

Measurement
Part of Marketing mix modelling for UK marketers: a practical guide
Marketing mix modelling for UK marketers: a practical guide
Marketing mix modelling gives UK marketers channel-level budget answers from aggregated data. What it needs, how to build a first model and how to test the result.
What to take away
- Marketing mix modelling estimates how each channel contributes to sales from aggregated spend and outcome data, so it does not need person-level tracking.
- It suits UK marketers who have lost individual-level signal to cookie limits and need channel-level budget answers.
- A usable model needs roughly two years of weekly or monthly spend, sales and external factor data.
- Outputs are directional, so test them against a controlled experiment before moving budgets.
- Modelling aggregated data still requires a lawful basis for the records you feed in.
Marketing mix modelling in plain terms
Marketing mix modelling, often shortened to MMM, is an econometric method. It regresses an outcome such as revenue or enquiries against spend by channel, then adds controls for price, season and distribution. The model returns a contribution estimate and a response curve for each channel. Because it works on totals, it never has to identify an individual.
MMM vs attribution
Marketing mix modelling
- Data used
- Aggregated totals
- Credit
- Channel contribution
- Identifiers
- Never needed
- Cookie loss
- Copes with gap
Attribution
- Data used
- Touchpoint identifiers
- Credit
- Touchpoint credit
- Identifiers
- Depends on them
- Cookie loss
- Thins out
This is where it differs from attribution, which hands credit to touchpoints. Attribution depends on identifiers, so it thins out as cookies and app signals disappear. MMM predates digital attribution and has returned to the agenda for the opposite reason: it copes with the gap.
Where UK media spend makes this practical
UK audiences are spread across broadcast, streaming, audio, social and retail media, and Ofcom's Media Nations is the standard public reference for how television and online attention splits, with Ofcom's Communications Market Report covering the wider market. Priors built from them are easier to defend than assumptions lifted from a platform dashboard.
For channel-level priors, the UK industry currencies are the practical starting point: BARB for television and streaming, RAJAR for radio and audio, IPA TouchPoints for cross-media planning, and JICMAIL for mail. They are panel-based rather than spend-based, but they give defensible reach and audience assumptions to compare your spend against.
Spend patterns matter as much as attention. A channel with almost no variation in spend gives the model nothing to estimate, however sound the method.
Business data counts too. The ONS digital economy collection covers internet use and e-commerce across UK firms — its internet use statistics and the E-commerce and ICT activity release are the datasets to pull — and it helps you judge how much of a client's outcome data sits in digital channels.
What the regulator says about aggregate measurement
The ICO's UK GDPR guidance does not prohibit modelling. It expects a lawful basis, transparency and data minimisation for the inputs you use, and the ICO publishes separate guidance on consent, on legitimate interests and on data minimisation. PECR still governs cookies, device access and electronic marketing alongside it. Aggregated outputs lower the privacy risk, but they do not remove the duty to handle the underlying records properly.
Modelling on totals is not a loophole. If a spend file is rebuilt from individual order records, those records still need a lawful basis and a retention limit.
What a model needs to be usable
Four inputs decide whether the output can be read at all.
The four inputs are:
- Spend by channel.Workable: consistent weekly or monthly spend for every material channel, offline included, over at least two years. Unworkable: a single blended media line, or spend logged only while a campaign is live.
- Outcome.Workable: one consistent series such as revenue or qualified enquiries, at the same grain as spend. Unworkable: a definition that changes mid-period, or a composite score with no fixed denominator.
- Controls.Workable: price, promotion, distribution, seasonality and competitor activity held as separate series. Unworkable: controls folded into the channel terms, which hands credit to whatever happened to move with sales.
- Coverage and variation.Workable: every material channel represented, with real movement in spend over time. Unworkable: a channel whose spend barely changes, or gaps filled by guesswork.
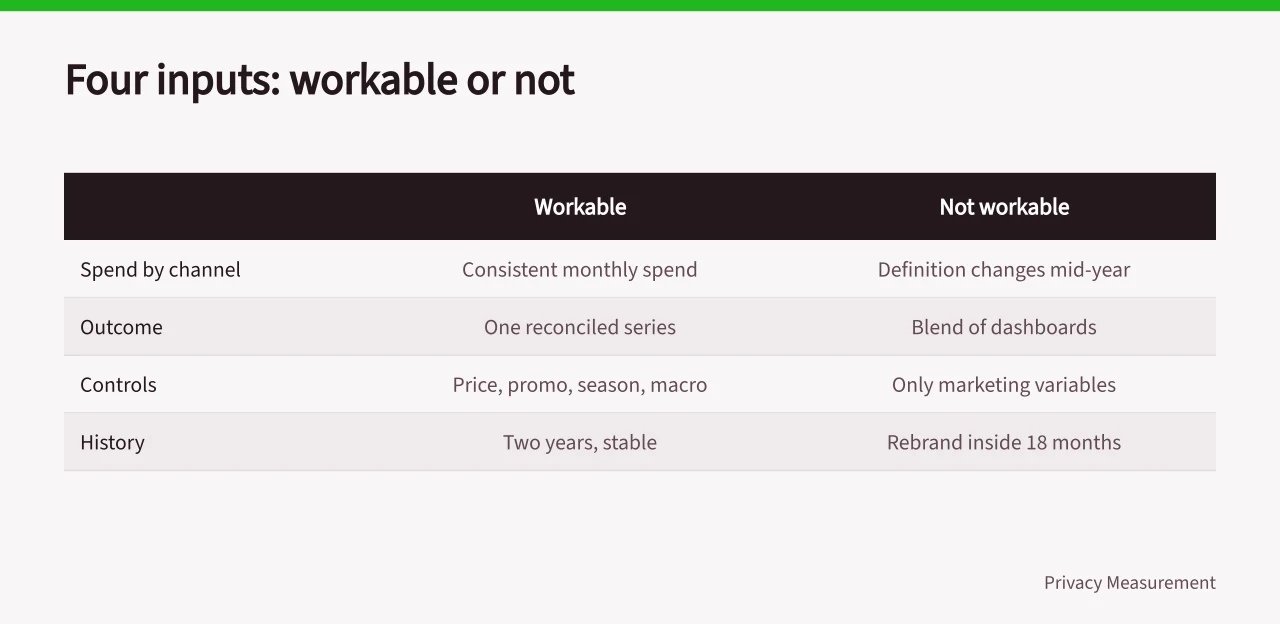
Treat each input as a workable or an unworkable condition, and fix anything in the unworkable case before you fit a model.
Running a first model: five steps
Running a first model
- Write down the decision the model must inform, such as next quarter's channel split.
- Assemble spend, outcome and control series at a consistent grain, usually monthly.
- Fit a baseline, then add channel terms and check the residuals for unexplained spikes.
- Stress the result by refitting on earlier periods and testing a holdout.
- Present ranges and assumptions rather than a single contribution figure.
If you are building rather than buying, Meta's Robyn and Google's Meridian are open-source MMM libraries that cover the regression, decomposition and response-curve steps above, and specialist agencies and analytics vendors offer modelling as a managed service. Whichever route you take, the four inputs decide the quality of the output far more than the tool does.
Reading the output honestly
A decomposition splits sales into baseline, seasonality and channel contribution. The baseline is usually the largest block, which surprises teams raised on attribution reports. If the model claims paid search did everything, the specification is wrong, not the market.
Response curves matter more than the headline split. They show where extra spend stops paying, and they are the part a finance team can argue with. Confidence intervals belong in the deck, not in an appendix. Before you act, run an incrementality test on the channel with the largest proposed change.
Common questions
These are the questions UK marketers ask most often about this kind of modelling.
Does marketing mix modelling use personal data?
Rarely. The model consumes aggregated spend and sales totals rather than individual records. Identifiable data used to build those totals still needs a lawful basis and a retention rule.
How much history does a model need?
Two years of consistent weekly or monthly data is the practical floor. Below that, seasonality and one-off spikes cannot be separated from real channel effects.
Can MMM replace attribution entirely?
No. It answers channel-level questions and cannot tell you which creative or audience segment worked. Run both if you can: the model for budget splits, attribution for tactical detail.
How do you know the result is trustworthy?
Check that the baseline is plausible, the response curves behave as expected, and the model survives a holdout period. A controlled test on one channel is stronger evidence still.